Starting with VoipNow 4.0, you can access web server performance statistics. There are two sets of performance indicators:
- Nginx statistics: Nginx is the web server that handles HTTP requests and provides access to the Voipnow web interface
- PHP-fpm statistics: PHP is the server-side scripting language used by VoipNow's web interface for backend processing tasks (image generation, database queries, etc).
Simply put, this is how the web server and PHP work:
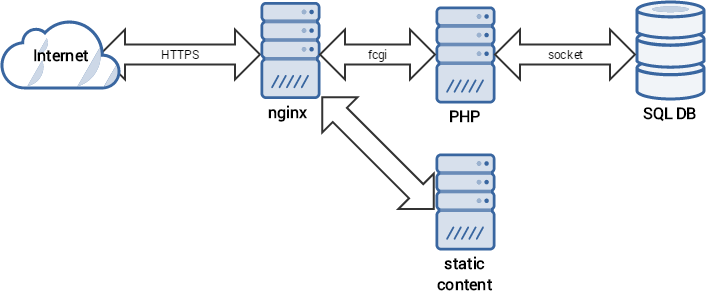
Step-by-step guide
Enabling access from your IP address
By default, the web server statistics are only accessible from the VoipNow server itself (the only IP allowed is 127.0.0.1).
To change this, follow these steps:
Edit the file
/usr/local/voipnow/admin/conf/voipnow-status.confwhich looks like this.Code Block # This file contains directives for monitoring. # You have to replace with your IP. Do not open this to the world! location ^~ /status-fpm { if ($my_https = "off") { return 301 https://$host$request_uri; } access_log off; allow 127.0.0.1; #allow #REPLACE.YOUR.IP; deny all; fastcgi_param SCRIPT_FILENAME /status-fpm; fastcgi_param SCRIPT_NAME /status-fpm; include /usr/local/voipnow/admin/conf/fastcgi-web*.conf; } location ^~ /status-fpm-worker { if ($my_https = "off") { return 301 https://$host$request_uri; } access_log off; allow 127.0.0.1; #allow #REPLACE.YOUR.IP; deny all; fastcgi_param SCRIPT_FILENAME /status-fpm-worker; fastcgi_param SCRIPT_NAME /status-fpm-worker; include /usr/local/voipnow/admin/conf/fastcgi-web*.conf; } location ^~ /status-httpsa { if ($my_https = "off") { return 301 https://$host$request_uri; } vhost_traffic_status_display; vhost_traffic_status_display_format html; access_log off; allow 127.0.0.1; #allow #REPLACE.YOUR.IP; deny all; }Remove the
#character at the beginning of the two#allowlines and replace the#REPLACE.YOUR.IPblock with your own IP address. For example, if your IP address is 10.10.10.25, the file needs to look like this:Code Block # This file contains directives for monitoring. # You have to replace with your IP. Do not open this to the world! location ^~ /status-fpm { if ($my_https = "off") { return 301 https://$host$request_uri; } access_log off; allow 127.0.0.1; allow 10.10.10.25; deny all; fastcgi_param SCRIPT_FILENAME /status-fpm; fastcgi_param SCRIPT_NAME /status-fpm; include /usr/local/voipnow/admin/conf/fastcgi-web*.conf; } location ^~ /status-fpm-worker { if ($my_https = "off") { return 301 https://$host$request_uri; } access_log off; allow 127.0.0.1; allow 10.10.10.25; deny all; fastcgi_param SCRIPT_FILENAME /status-fpm-worker; fastcgi_param SCRIPT_NAME /status-fpm-worker; include /usr/local/voipnow/admin/conf/fastcgi-web*.conf; } location ^~ /status-httpsa { if ($my_https = "off") { return 301 https://$host$request_uri; } vhost_traffic_status_display; vhost_traffic_status_display_format html; access_log off; allow 127.0.0.1; allow 10.10.10.25; deny all; }Save the file and restart the VoipNow web interface:
Code Block # /etc/init.d/voipnow restart Stopping VoipNow Web Management Interface: [ OK ] Starting VoipNow Web Management Interface: [ OK ]
Access web server statistics
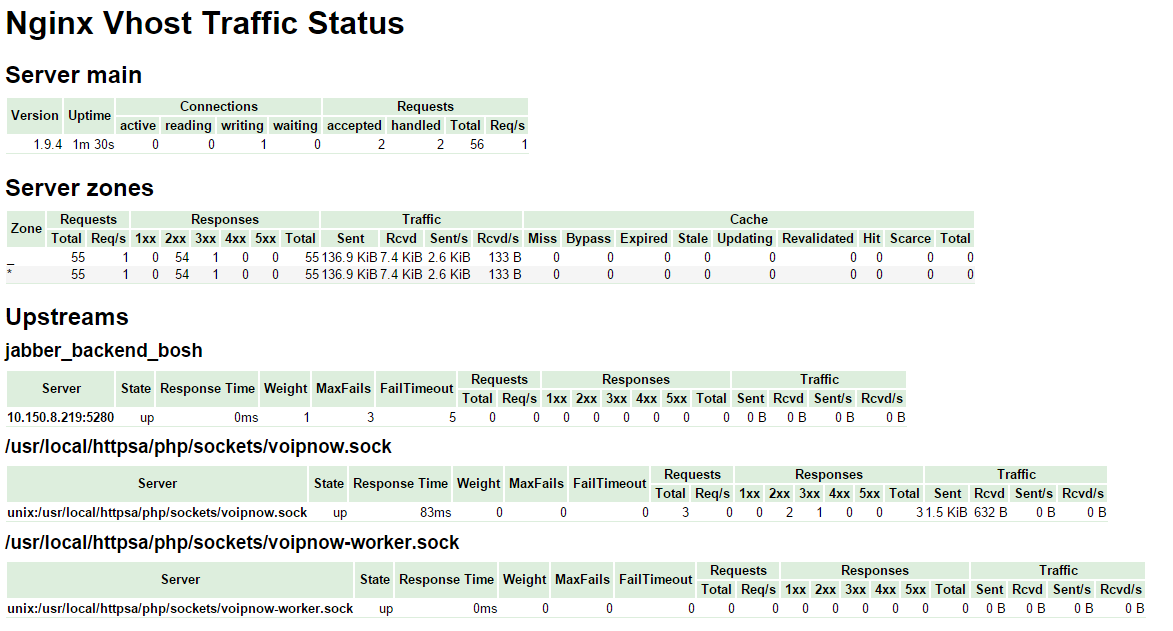
The web server statistics can now be accessed at the following web address: https://VOIPNOW_IP/status-httpsa (replace VOIPNOW_IP with your VoipNow server IP address).
On this page you will find generic performance indicators for the Nginx web server:
- Server main: version, uptime, number and status of web server connections and requests
- Server zones: number of requests, response types grouped by HTTP response code, traffic and caching statistics
- Upstreams: the backend connections' status (Jabber, PHP and PHP workers)
Access PHP statistics
The PHP statistics page can be accessed at https://VOIPNOW_IP/status-fpm (replace VOIPNOW_IP with your VoipNow server IP address). The output displayed will be similar to this:
| Code Block | ||||
|---|---|---|---|---|
| ||||
pool: voipnow process manager: dynamic start time: 11/Dec/2015:10:07:17 +0000 start since: 54 accepted conn: 3 listen queue: 0 max listen queue: 0 listen queue len: 0 idle processes: 4 active processes: 1 total processes: 5 max active processes: 1 max children reached: 0 slow requests: 0 stats[1449828437]:["10":"1", "20":"0", "30":"0", "40":"1", "50":"0", "60":"0", "70":"0", "80":"0", "90":"0", "100":"0", "over":"0"] |
While most of the values are self-explanatory, you should know that the stats array indicates the percentile distribution compared to the request_slowlog_timeout parameter, which has a default value of 1 second. For example:
- 10 refers to how many requests were served between 0-10% of the
request_slowlog_timeoutparameter (between 0 and 3 seconds in the default configuration) - 20 refers to how many requests were served between 10-20% of the
request_slowlog_timeoutparameter (between 3 and 6 seconds in the default configuration) - ...
- 100 refers to how many requests were served between 90-100% of the
request_slowlog_timeoutparameter (between 27 and 30 seconds in the default configuration) overrefers to how many requests were served over 100% of the therequest_slowlog_timeoutparameter (over 30 seconds in the default configuration)
Possible reasons for concern
Nginx
The following indicators should be monitored:
- number of responses with 4xx/5xx status codes - a high number of responses with these codes can indicate a bruteforce/vulnerability scanner pointed at your server
- the state of all upstreams should be up
PHP
The following should be monitored:
- the "start since" value should be a high number, indicating that the PHP processes did not crash recently
- the slow requests should be a low number, indicating that all PHP scripts are executing in a reasonable time
- the stats array should not have too many requests in the 80, 90, 100 and
overkeys (this indicates your web server is overloaded)
Related articles
| Page properties | ||
|---|---|---|
| ||
|
 Except where otherwise noted, content in this space is licensed under a Creative Commons Attribution 4.0 International.