| Note |
|---|
Applies to VoipNow 5.X.X! |
Service providers, organization owners and users interact with the VoipNow interface in many ways. They may edit account details, add new user accounts, delete call reports, add or remove extensions, etc.
VoipNow keeps track of all these actions, generically called requests. With the help of the Request Log feature, admins can monitor and audit them from the web interface.
This article explains how to set up a request log, the kind of information gathered in it, and how to manage it.
Set up a log
VoipNow lets you monitor four types of requests: create, edit, read and delete. You may set up the log to track all of them or only specific ones.
To do this, take the following steps:
- Go to Unified Communications in the left menu and click Request Log under the Monitoring area. The Request Log page will open.
- Press the Define Log button. From the Log settings dialogue window that opens, select the requests you want to monitor.
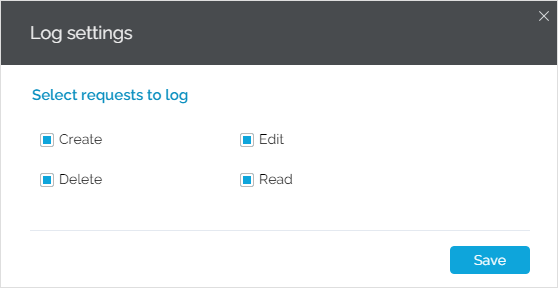
Press Save when you're done. A confirmation message on your settings will be displayed at the top of the interface.
Now you can move on to the Log of user requests area. All operations will be displayed in a table that you can search through using the filters at the top. Read below for more explanations.
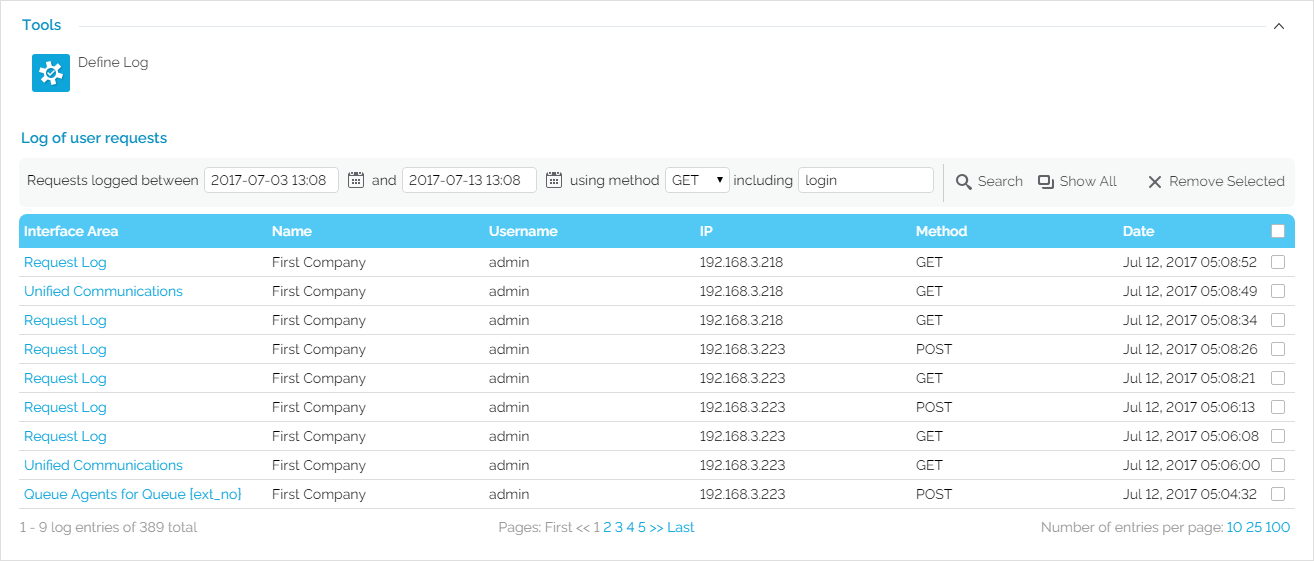
- You may set a time interval. To specify the start and end date of the logged operations, press the calendar icon next to the Requests logged between .... and... field and select the dates.
- You may also filter operations by method, in case you don't need to see them all. From the using method drop-down list, select your log to display only operations using the GET or the POST method. If you want the log to display all operations, regardless of their method, leave the default ANY as is.
- The log can also display operations based on specific keywords like "login" or "account", for example. Just type the keyword in the including search field.
5. When you're done setting all these filters, press the  Search icon.
Based on your customized filters, operations will be displayed with the following details: page, date, name and username of the person performing the operation, the IP of the server on which the operation was performed as well as the method used.
| Note |
|---|
Pressing the Show All button will display all logged operations as specified in the Log settings window. |
If you want to adjust the number of operations displayed in the log table, select the Number of entries per page at the bottom right.
Learn more on logged operations
Aside from the operation details displayed in the table, details on the user's input during logged operations are available.
To view them, click on the operation you're interested in, i.e. the entry in the Interface Area column, and a pop-up similar to the one below will be displayed.
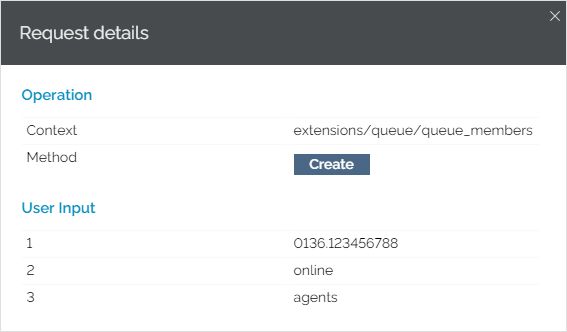
The operation is detailed in terms of context (i.e. the interface flow), method (create, read, edit or delete) and user input (i.e. save, edit, search, login, etc).
Remove logged operations
| Note |
|---|
Please note that deleted logs cannot be recovered! |
If you need to clear log entries, select their corresponding checkboxes and then press the Remove Selected button at the top right of the table.
Related topics
Content by Label showLabels false max 5 spaces KB showSpace false sort modified type page cql label in ("monitoring","audit","interface") and space = currentSpace() labels kb-how-to-article
 Except where otherwise noted, content in this space is licensed under a Creative Commons Attribution 4.0 International.