This page describes the Unanswered Calls Report, which provides info on the calls that were not answered by queue agents, the SLA and the disconnection causes for the specified time interval.
About
The Unanswered Calls page displays detailed information about the calls that were not answered, the SLA and the disconnection causes. To access this page, click the Unanswered Calls tab. The statistical data is structured in several sections, that you will find explained below.
Queue overview
This section displays details about the queue's unanswered calls.
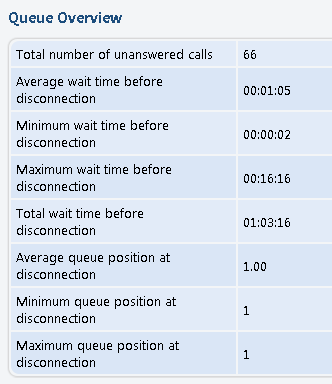
| Row | Description |
|---|---|
| Total number of unanswered calls | The total number of calls assigned to the queue that were not answered by the queue members. |
| Average wait time before disconnection | The average time spent in queue by the users before their calls were interrupted. |
| Minimum wait time before disconnection | The minimum time spent in queue by an user before his call was interrupted. |
| Maximum wait time before disconnection | The maximum time spent in queue by an user before his call was interrupted. |
| Total wait time before disconnection | The total time spent in queue by all the users before their calls were interrupted. |
| Average queue position at disconnection | The average queue position of an user before his call was interrupted. |
| Minimum queue position at disconnection | The minimum queue position of an user before his call was interrupted. |
| Maximum queue position at disconnection | The maximum queue position of an user before his call was interrupted. |
Service Level Agreement
This section allows you to keep track of the number of calls that were not answered within a certain SLA. The line chart helps you visualize the distribution of unanswered calls per SLA intervals.
- Answered: The SLA time interval. The available SLA intervals range from Between 0 and 10 seconds to After 480 seconds.
- Calls: The number of calls not answered within a certain SLA.
- Percent: The percentage of unanswered calls out of the total calls received within a certain SLA.
Disconnection causes
The pie chart and the table display the reasons for which the calls could not be answered.
| Column | Description |
|---|---|
| Call type | The reasons that caused the calls to be disconnected.
For more information on what the Call Listing for <event> pages are structured, please read the Calls Overview section below. |
| Calls | The number of calls unanswered due to a specific cause. If there is at leas one call, you may click the link to be redirected to the page that displays detailed information about all the calls unanswered due to a particular cause. |
| Percent | The percentage of calls unanswered due to a specific cause out of the total unanswered calls. |
Statistics for a time interval
When you want to visualize the statistics for a certain time interval, you can define its limits by using the available search controls:
Analyzing records between <start_date> and <end_date>
Where:
- <start_date>: Use the available text box or the calendar icon to specify the starting date of the time interval you want the statistics to be displayed for. The format must be yyyy-mm-dd. The default value is the first day of the current month.
- <end_date>: Use the available text box or the calendar icon to specify the ending date of the time interval you want the statistics to be displayed for. The format must be yyyy-mm-dd. The default value is the current date.
After you have decided on the time interval you want the statistics to be displayed for, click the Search link. The graphics will be updated.
The dates are saved even if you navigate to other pages. All the other queue statistics pages display records for the same time interval.
If there were no calls between the selected dates, then the graphics will not be generated!
Calls overview
The content of this page is identical for all the disconnection causes, providing the same information about the unanswered calls for each one of the causes. Generically, the page is called Call Listing for Event <disconnection_cause> and it displays up-to-date details about calls ended without being answered by any of the queue agents.
The Calls Overview provides the following details about the unanswered calls:
- CallerID: The caller's identification number, for example <8754>, or, if the call was initiated from inside the system, the extension number (e.g. 007 or 0001*007) of the person who made the call.
- Agent: The extension number (e.g. (0003*001) - for local agents) or his name (for remote agents) of the queue agent that picked up the call. In this situation, VoipNow displays None.
- CallID: The unique number that Asterisk generated to identify the call.
- Start time: The date and time the call was terminated due to a specific reason.
Statistics for a time interval
When you want to visualize the statistics for a certain time interval, you can define its limits by using the available search controls:
Analyzing records between <start_date> and <end_date>
Where:
- <start_date>: The starting date of the time interval you want the statistics to be displayed for. The format must be yyyy-mm-dd. Default: the first day of the current month.
- <end_date>: The ending date of the time interval you want the statistics to be displayed for. The format must be yyyy-mm-dd. Default: the current date.
After you have decided on the time interval you want the statistics to be displayed for, click the Search link. The graphics will be updated.
The dates are saved even if you navigate to other pages. All the other queue statistics pages display records for the same time interval.
 Except where otherwise noted, content in this space is licensed under a Creative Commons Attribution 4.0 International.